Here is the result of a poll run on a sample of 2,000 UK web users, carried out online between the 18th & 21st June 2016. Demographic data was collected for 1485 of those responses. Below you’ll find:
- An overall summary result.
- Results excluding ‘undecided’ voters.
- Split by age.
- Split by gender.
Data was gathered anonymously, asking the referendum question, and is summarised weighted against the internet population of the UK.
Overall Summary:
- Excluding ‘Undecided’, 53.4% prefer ‘Remain’ while 46.6% prefer ‘Leave’.
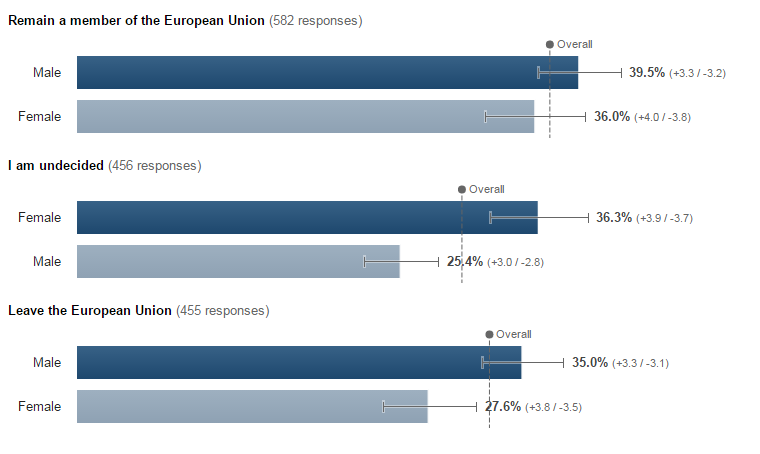
- Men were slightly more likely to answer ‘Remain’ than women; paradoxically men were also more likely to answer ‘Leave’ than women. Men were much more likely to give an answer one way or the other, whereas a higher percentage of women answered ‘Undecided’.
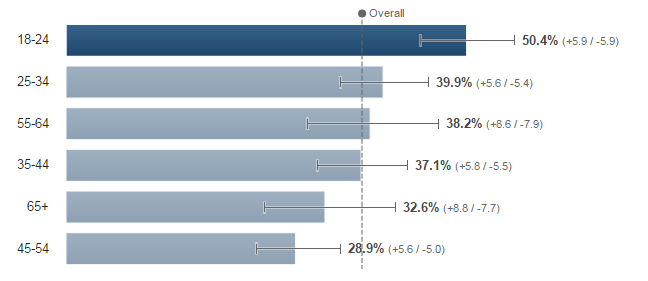
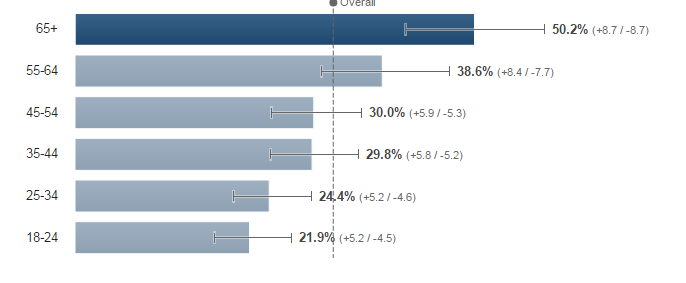
- Age is a strong predictor of response. 18-24 year olds were most likely to answer ‘Remain’; 65+ year olds were more likely to answer ‘Leave’.
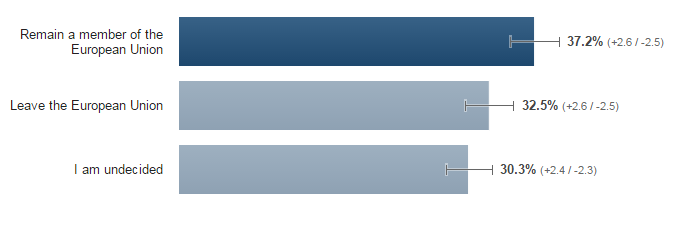
Weighted Results:
“Should the United Kingdom remain a member of the European Union or leave the European Union?”
- Remain: 37.2%
- Leave: 32.5%
- Undecided: 30.3%
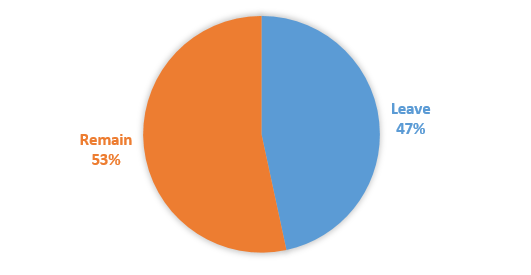
Results excluding ‘Undecided’
Stripping out the ‘Undecided’ portion, the results are as follows:
- Remain: 53.4%
- Leave: 46.6%
‘Split by Age:
The ‘Remain’ group, broken down by age group, is as follows:
The ‘Leave’ group, broken down by age group, is as follows:
Split by Gender:
Appendix:
- The poll ran & as displayed to a random sample of users within the UK.
- The question was worded as per the official question.
- There are lots of caveats with data such as this. It is a ‘snapshot’ rather than a ‘prediction’.
- I have asked the specific ballot question, rather than framing it as “If you were to vote today…?”.
- I’ve left error bars on the results so that you can see the variability.
- I included a series of caveats & additional notes on a previous similar poll I ran. You can read those in the ‘caveats’ section of this post.
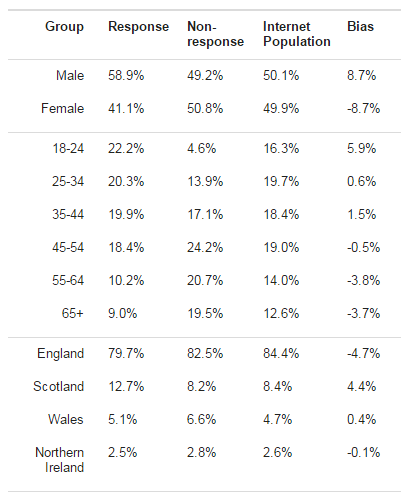
- For full clarity, here is the breakdown of respondents, and their bias vs the general ‘Internet Population’ of Scotland