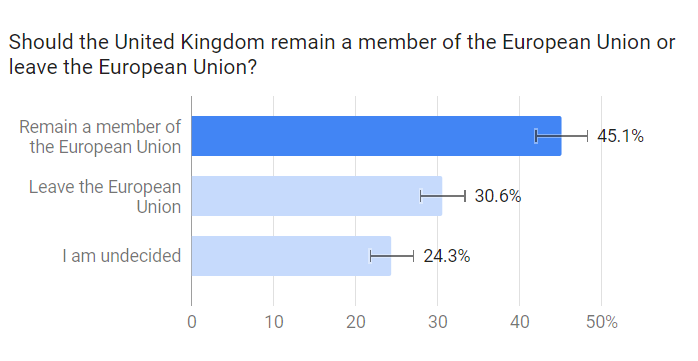
Below is the results of a nationwide survey of 1,000 people carried out in December 2017. Results are weighted to match the UK internet population.
This asks the official UK EU Referendum question “Should the United Kingdom remain a member of the European Union or leave the European Union?”.
Summary:
Remain: 45.1%
Leave: 30.6%
Undecided: 24.3%
The distance between ‘Remain’ & ‘Leave’ of 14.55% points is the highest in all polls I’ve carried out since the referendum.
Immediately post referendum, a large shift seemed to take place between the ‘Undecided’ group and ‘Leave’. This poll contains the largest indicator so far of any shift from ‘Leave’ to ‘Remain’.
Details:
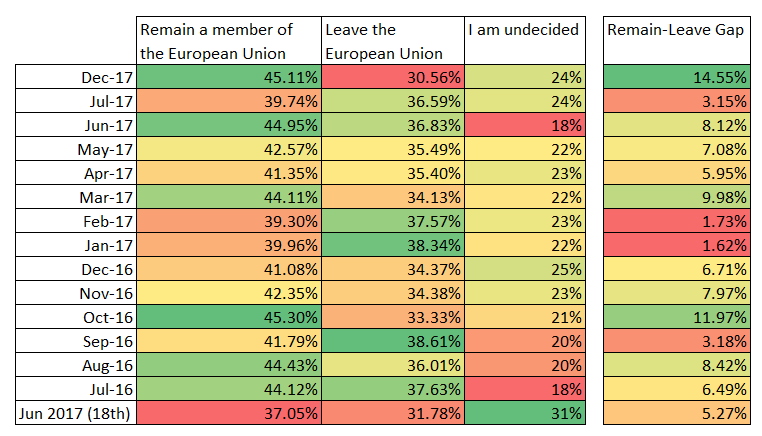
Having carried out around 30 such polls (each of which covers the UK, and is weighted by age and gender to match UK population), I looked back to take a look at the data for the year since the EU Referendum, followed by the most recent survey.
As can be seen by the final column, the ‘Remain-Leave Gap’ (the difference between the % answering ‘Remain’ and % answering ‘Leave’) is the highest it has been since the referendum date. ‘Undecided’ remains fairly stable, while ‘Leave’ is down and ‘Remain’ is up.
Notes & Caveats:
The question here was as per the official question, it does not ask “If there were another referendum today…” or attempt to judge how people would vote, it is instead a snapshot of opinion.
No attempt is made to gather whether users are eligible to vote, or were eligible to vote at the point of the referendum.
Weighting is vs the UK internet population, which sways slightly younger than overall population.
Data is gathered via the internet, fieldwork was carried out between 19-22 Dec 2017.
This post simply includes 2 pieces of information: Answers to the question “Should the United Kingdom remain a member of the European Union or leave the European Union?” from the weekend immediately prior to the referendum, and answers to the same question, surveyed on 23rd August 2016 (ie. exactly 2 months after the referendum).
Responses to a survey on “the Brexit Question” immediately prior to the vote:
(data here is from 2,008 responses, weighted on the basis of demographic information from 1,485 respondents. All were in the UK, but were not qualified on eligibility to vote, 犀利士 or on whether they intended to vote)
Responses to a survey on “the Brexit Question” exactly 2 months after the vote:
(data here is from 1,002 responses, weighted on the basis of demographic information from 763 respondents. All were in the UK, but were not qualified on eligibility to vote, or on whether they had/had not voted)
Summary
A summary of the change in the above numbers is as follows:
Immediately prior to the referendum, the survey indicated a likely ‘Remain’ vote. As you can see from the error percentages, a “Leave” vote was within the margin of error. (ie, the poll was inconclusive)
2 months following the referendum, the ‘Remain’ percentage has grown significantly; the ‘Leave’ percentage has grown by a smaller amount (but has still grown), and the ‘Undecided’ percentage has dropped by over 10 percentage points, with roughly 80% of that ‘undecided’ pool going to ‘Remain’, and roughly 20% going to ‘Leave’. The error bars no longer overlap (ie, the respondents to the poll were, overall, in favour of remaining)
Caveats
As always, this is simply a snapshot poll, not an actual vote with real-world ramifications.
The 2 pools polled are not identical (ie. the survey respondents are not the same people)
None of the above is qualified by actual intention to vote, or whether the respondents voted or not.
Many more caveats apply. If you would like me to go into further detail on those, please do let me know.
(For full clarity: I do this purely out of interest, and fund it myself).
“What would happen if you reran the UK’s “in/out” EU Referendum today, having seen the news headlines immediately following the announcement of the result?”
I am sure many have asked the question. As you will surely know: It is not possible to answer with anything even approaching a rough degree of certainty. However, I have been running opinion polls on the Brexit question for the last year, and have carried out 3 across June (2x before, 1x after announcement of the result). While opinion polls are far from perfect, they do still help in understanding rough trends.
Below are the results of an opinion poll carried out immediately prior to the Brexit vote; followed by a poll carried out over the days immediately after.
First is a straight ‘Before & After’ comparison of the 2 polls. Below that is a little greater detail on each of the polls. Additionally, there is data gathered over the last year on ‘the Brexit’ question, to add further context to the results.
Note of Caution: I am not publishing this to suggest that there should be another referendum. I am simply publishing as I have been tracking this for the last year, and found the massive change in results very interesting.
Before & After
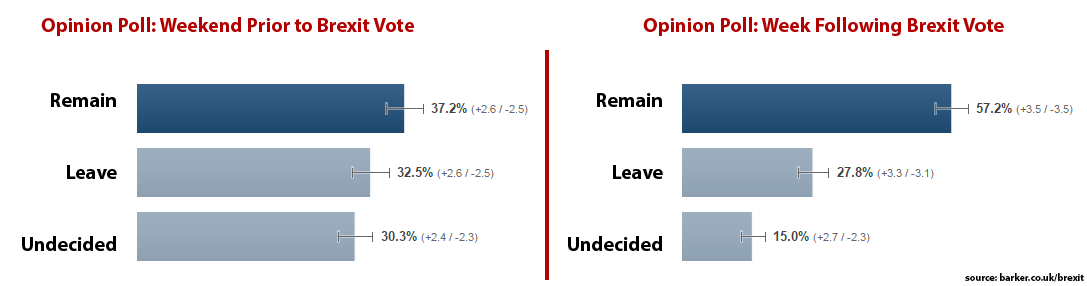
Below is a comparison of an opinion poll carried out over the weekend prior to the ‘Brexit’ vote, compared to the same poll carried out over the week following the announcement of results:
Summary: The poll results show a big shift from the ‘Undecided’ group to the ‘Remain’ group. The size of the ‘Leave’ group changes, but only by 4-5% points.
Each poll here was anonymous, carried out among adults in the UK, via the internet. There were 2,018 responses gathered in the ‘before’ poll. There were & 1,092 responses to the ‘after’ poll. The data is weighted based on the internet population of the UK, and that weighting is based on demographic data from 1,485 respondents in the ‘before’ poll, and 829 respondents in the ‘after’ poll.
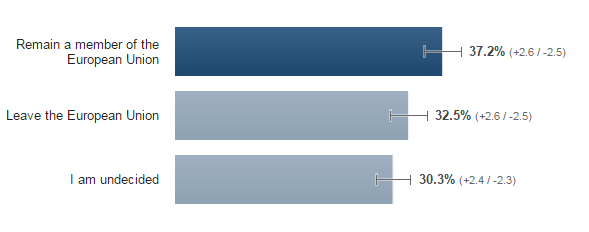
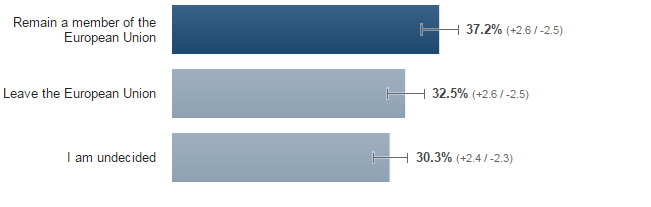
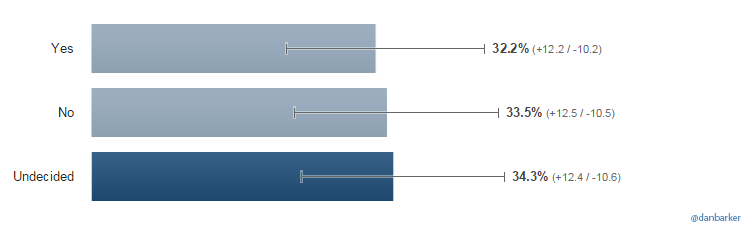
More Detail: Result Immediately Prior to the Vote
Here were the results of the poll, carried out over the weekend immediately prior to the referendum, including additional notes:
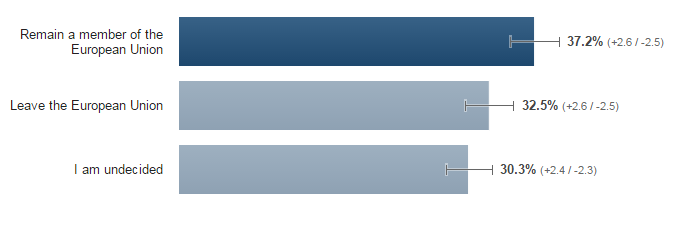
Notes:
The ‘undecided’ group is quite high. This was a UK-wide poll, with no filter question clarifying whether respondents were registered to vote. Ie, it is representative of adults in the UK, not just voters.
Importantly: ‘Remain’ polled at 37.2%, the ‘Leave’ answer polled at 32.5%. You can see from the bars that each had a margin of error of +2.6/-2.5. Ie, the ‘Remain’ result was predicted between 34.7 and 39.8; the ‘Leave’ result predicted between 30.0% and 35.1%. Ie – according to the snapshot poll – ‘Remain’ would probably win, but there was a chance ‘Leave’ would prevail.
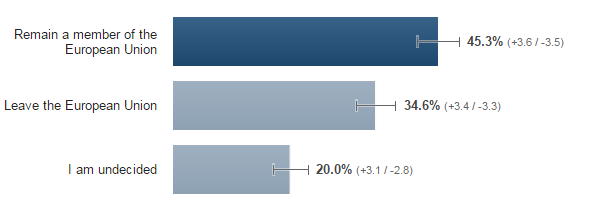
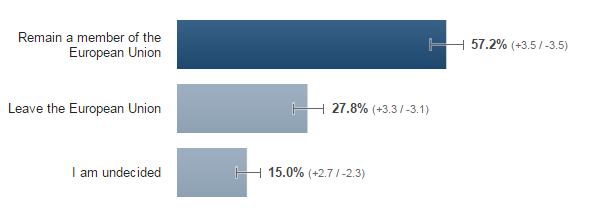
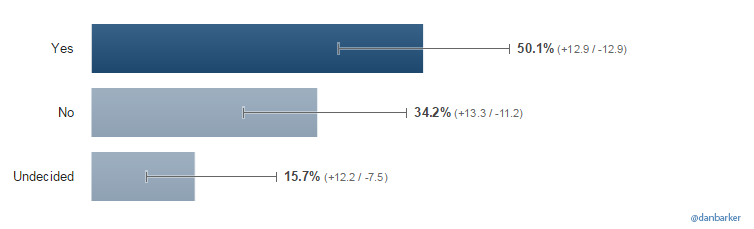
More Detail: Result Immediately After the Vote Result
Here is the same poll, carried out in the days immediately after the vote was announced, and newspaper headlines and politicians across the world reacted. The data here was gathered between 24th-29th June 2016. Again, I have included additional notes:
3 notes there:
‘Remain’ has leapt enormously.
‘Leave’ has dropped, but only by 4 or 5 percentage points.
The ‘undecided’ group has dropped hugely – from 30% to 15%.
Based purely on this poll, those believing the UK should remain a member of the EU outnumbered those who believe we should leave the EU by a margin of 2:1 after the referendum result was announced & newspaper headlines and politicians had responded to the result.
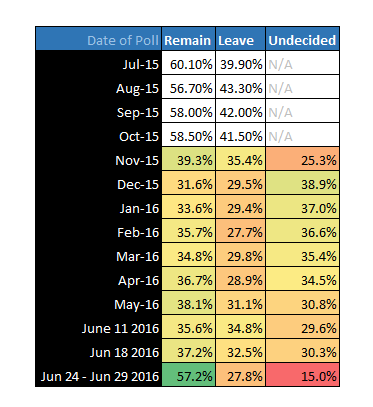
More Detail: Data Gathered over the Last Year:
Below is a summary of most of the Brexit polls I have carried out over the last year, to add context, and further illustrate the large change in results. Most were carried out 犀利士 among just over 2,000 respondents; one or two were carried out with just over 1,000 respondents. The early polls I chose to omit the ‘Undecided’ group. The referendum question changed late last year, from a ‘Yes/No’ question to ‘Remain/Leave’.
Summary:
Among these polls, there is a large swing from ‘Undecided’ to ‘Remain’ following the announcement of the results.
The ‘Leave’ group has dropped, but had polled at similar levels previously.
The ‘Undecided’ group has dropped significantly.
Important Caveats
Above are simply opinion polls. As we all know, opinion polls do not necessarily predict the actual result of elections or referendums, they simply offer a snapshot of opinion among a group of respondents. The respondents above were in the UK, but not necessarily registered to vote.
Here is the result of a poll run on a sample of 2,000 UK web users, carried out online between the 18th & 21st June 2016. Demographic data was collected for 1485 of those responses. Below you’ll find:
An overall summary result.
Results excluding ‘undecided’ voters.
Split by age.
Split by gender.
Data was gathered anonymously, asking the referendum question, and is summarised weighted against the internet population of the UK.
Overall Summary:
Excluding ‘Undecided’, 53.4% prefer ‘Remain’ while 46.6% prefer ‘Leave’.
Men were slightly more likely to answer ‘Remain’ than women; paradoxically men were also more likely to answer ‘Leave’ than women. Men were much more likely to give an answer one way or the other, whereas a higher percentage of women answered ‘Undecided’.
Age is a strong predictor of response. 18-24 year olds were most likely to answer ‘Remain’; 65+ year olds were more likely to answer ‘Leave’.
Weighted Results:
“Should the United Kingdom remain a member of the European Union or leave the European Union?”
Remain: 37.2%
Leave: 32.5%
Undecided: 30.3%
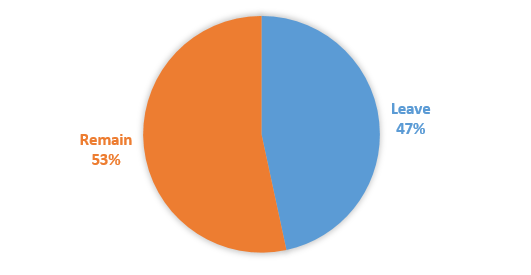
Results excluding ‘Undecided’
Stripping out the ‘Undecided’ portion, the results are as follows:
Remain: 53.4%
Leave: 46.6%
‘Split by Age:
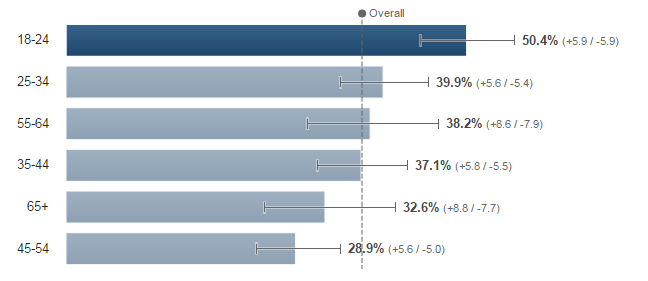
The ‘Remain’ group, broken down by age group, is as follows:
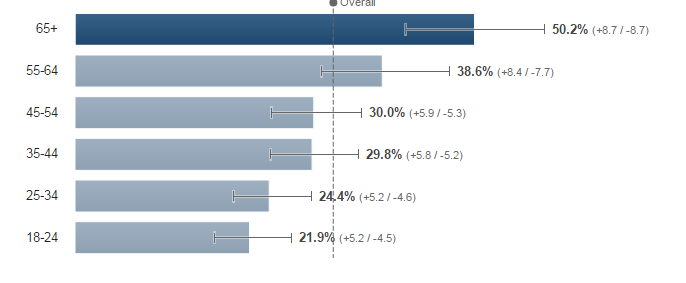
The ‘Leave’ group, broken down by age group, is as follows:
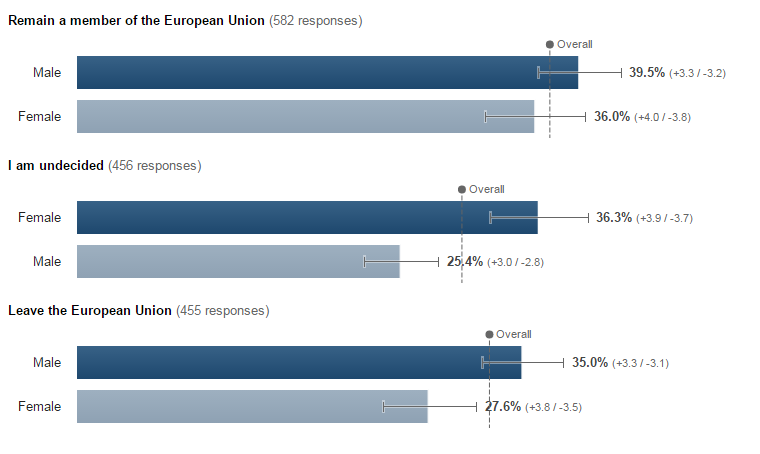
Split by Gender:
Appendix:
The poll ran & as displayed to a random sample of users within the UK.
The question was worded as per the official question.
There are lots of caveats with data such as this. It is a ‘snapshot’ rather than a ‘prediction’.
I have asked the specific ballot question, rather than framing it as “If you were to vote today…?”.
I’ve left error bars on the results so that you can see the variability.
I included a series of caveats & additional notes on a previous similar poll I ran. You can read those in the ‘caveats’ section of this post.
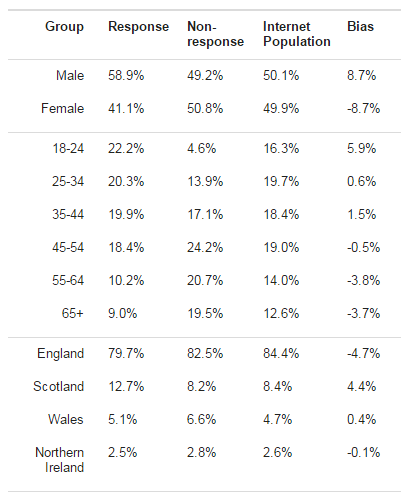
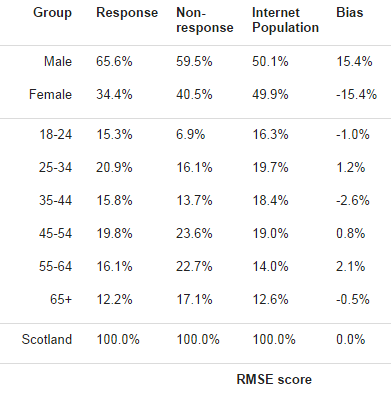
For full clarity, here is the breakdown of respondents, and their bias vs the general ‘Internet Population’ of Scotland
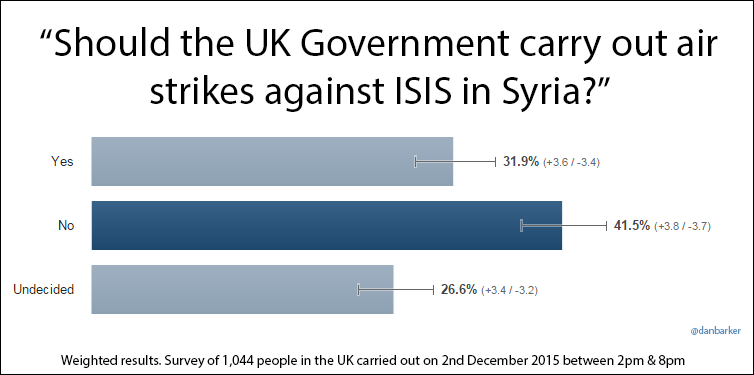
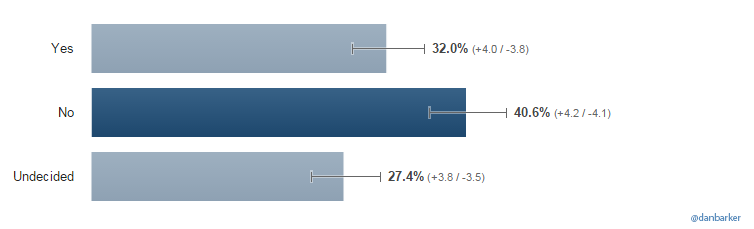
Here are the results of a survey of 1,044 people in the UK asking whether the UK government should carry out air strikes against ISIS in Syria. The exact question wording was as follows:
“Should the UK Government carry out air strikes against ISIS in Syria?”
All answers were gathered between 13:52 & 19:40 on Wednesday 2nd, December 2015, at the time the motion was being discussed in Parliament. Below are the overall results, followed by splits by Gender, Age, and Region.
Topline Results
There were 1,044 responses. Unweighted the results came at 43.3% against air strikes, 30.0% in favour, 26.7% undecided.
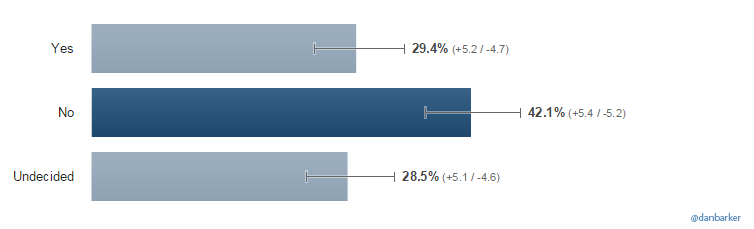
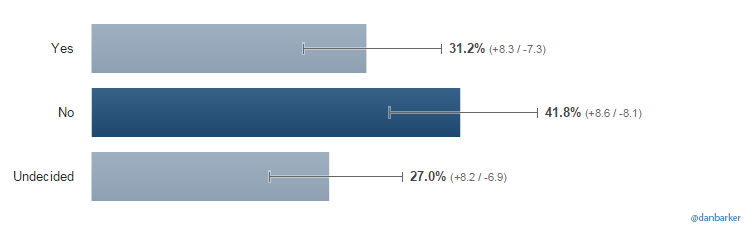
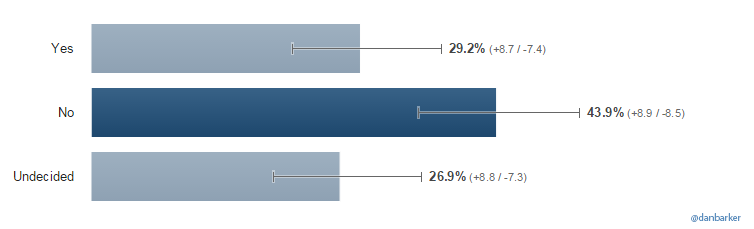
The weighted responses (778 demographic profiles available) came out as follows:
Summary:
The result was statistically significant. “No” in answer to the question “Should the UK Government carry out air strikes against ISIS in Syria?”
Further breakdown:
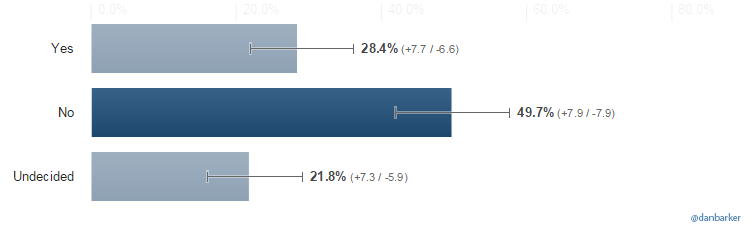
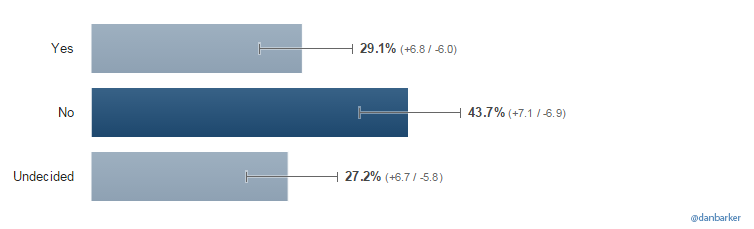
Women were more likely to say “No” than men (42.1% women; 39.6% men)
Older age groups were more likely to say “Yes” than younger groups.
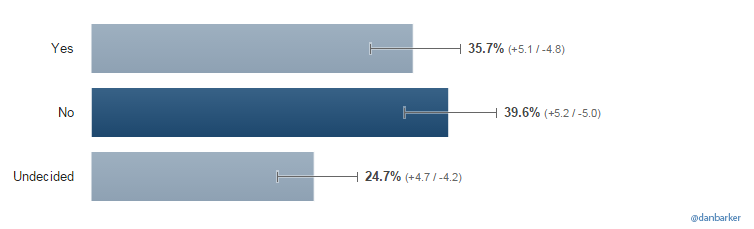
Results by Gender
Below are results split by male / female responses.
Male Responses
Female Responses
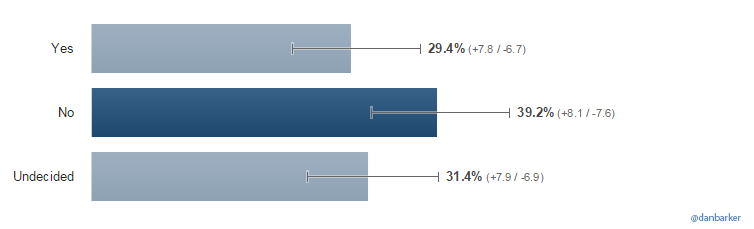
Results by Age Range
Below are responses split by age group.
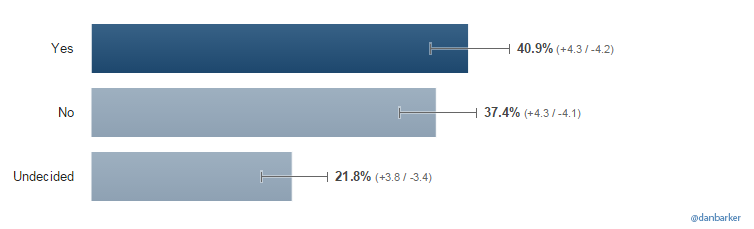
18-24 Age Group
25-34 Age Group
35-44 Age Group
45-54 Age Group
55-64 Age Group
65+ Age Group
Results by Region
England
Scotland
Wales
(note: Just 32 responses from Wales, so not enough to judge. Included for completeness)
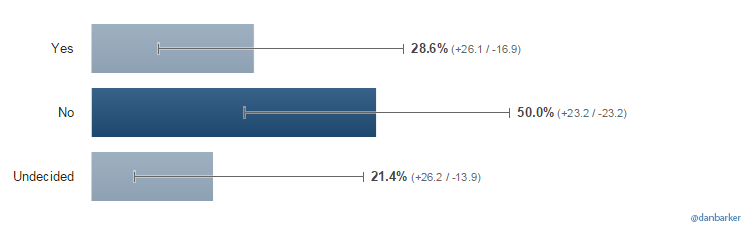
Northern Ireland
(note: Just 14 responses from Northern Ireland, so not enough to judge. Included for completeness)
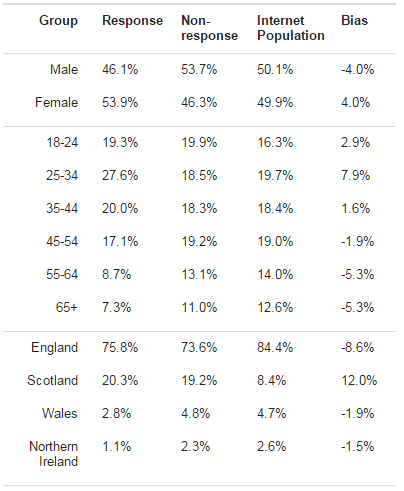
About the Data
Here’s the sampling bias that was used for weighting (vs the Internet Population of the UK)
All data was gathered by asking the question of UK internet users, between 2pm and 8pm on 2nd December 2015. Users were browsing a mixture of news sites, reference sites, mobile apps, and other general interest websites. As with all polling, there are many caveats on this data, I do not list these in there entirety, but feel free to ask if you are intested.
I fund all polling myself. Do share this post if you find it useful. Feel free to ask any further questions, or follow me on Twitter (@danbarker) if you find this of interest.
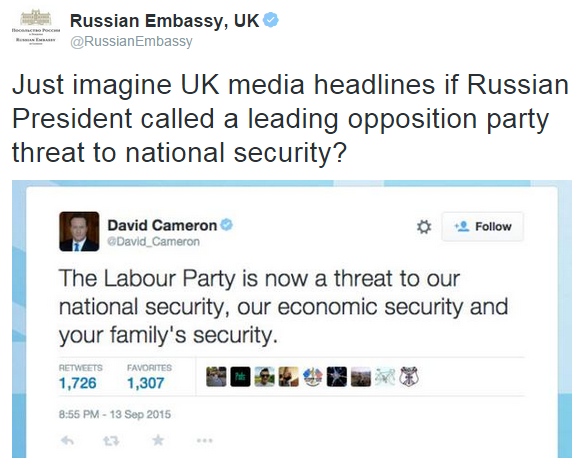
In the UK, the main opposition party just appointed a new leader. A man called Jeremy Corbyn. Many of the country’s leading newspapers have since cast him variously as a buffoon, a court jester, a threat to security, a terrorist sympathiser, and various other extremely negative figures. Even newspapers that traditionally support his party seem critical.
On the other hand: His most loyal fans seem to absolutely love him. He increased his Twitter follower count by roughly 100,000 followers in the few days after his election, and there are thousands of vocal people complaining across social media about his treatment by the media & his opponents. Including the Russian Embassy (albeit this is really a dig at the current Prime Minister, than a nod of support for his opponent):
So it’s quite difficult to understand: Was he wildly unpopular outside of the two hundred and twenty something thousand people who voted him in as their party leader? Have those who were sympathetic to him suddenly turned?
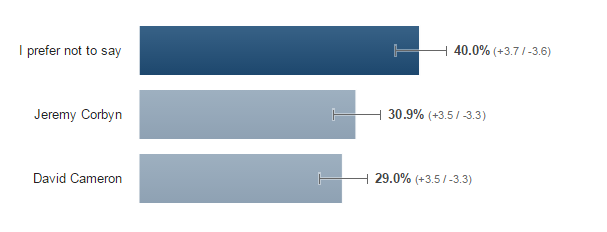
I ran a quick survey of 1,000 people in the UK to gather a little bit of data. This doesn’t answer all of the questions above, but does contain the answer to the following question, according to a snapshot of 1,000 people:
“If there was an election today, who would you prefer to become Prime Minister of the UK?”
Here were the results:
In summary: Jeremy Corbyn came out ahead by a very short nose (30.9% vs David Cameron’s 29%). As you can see from the error bars there: it’s too close to call, but from a snapshot of 1,000 responses the two are within a few percentage points of each other.
Notes:
Often polls don’t include the “I don’t want to say” question. In an actual election, voting is not enforced, therefore it’s worth including this potential answer.
From the group above, age & gender profiles were available for 800 of the respondents.
The data was gathered at the beginning of the week. Opinions change quickly. Let me know if you’d like me to rerun the above now, or in the future. I suspect the result of the survey will swing wildly as Jeremy Corbyn is very much a big news story at the moment, therefore I’ll likely run the survey again shortly.
The above data is weighted to match the general internet-using population of the UK.
Minor note: The wording should technically be “If there were an election”. I went with the more common “If there was”.
Elections in the UK – of course – aren’t decided on the basis of a question like the above. The survey is designed simply to canvas opinion.
Breakdown by demographics
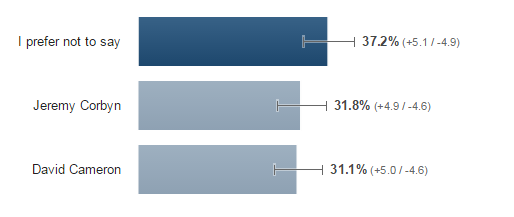
Results from 357 male respondents:
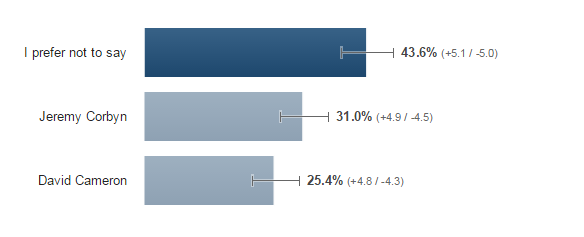
Results from 409 female respondents:
Additional data points:
There were 116 responses from Scotland. 29% of those chose ‘Jeremy Corbyn’, 16.8% chose ‘David Cameron’.
The overall result of the 22 responses from Wales put Cameron ahead.
The overall result of the 16 responses from Northern Ireland put Cameron ahead.
Realistically, the numbers are too small from Scotland/Wales/NI to draw any verdicts.
In England, where there were 610 responses, the result was closest: 32.5% Corbyn vs 28.5% Cameron. (majority ‘prefer not to say’)
As ever, there are many more nuances & caveats to the above, but the result is interesting nonetheless.
Hillary Clinton has officially announced she’s running for US presidency in 2016. This was all handled rather well online, with a high-production value video, a quick change of all of her social accounts, and the launch of a new campaign site.
Alongside the positives, there were however a few mistakes. None of these were ‘campaign ruining’, but some were surprising tech blunders for such a high profile launch, and some meant they both missed out on potential early traffic to the campaign website and made a few of their bigger supporters look a little foolish.
I’ve catalogued a few of the nicer elements & odd errors here:
1. There are some nice little tech touches on the site.
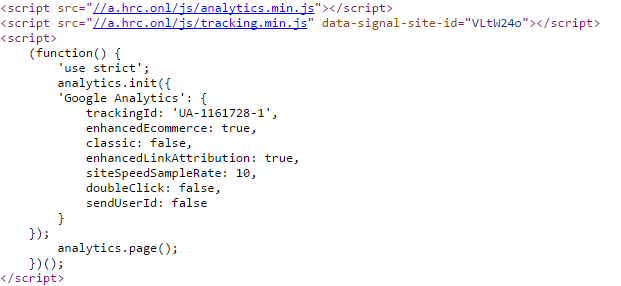
There are various little nice touches on the ‘Hillary’ site. The site itself is nicely responsive, the code is fairly light, and there are some nice little touches from a technical point of view. For example, here you can see they’ve minified all the tracking code and gone to the trouble of registering ‘hrc.onl’ to have a shorter domain name to serve code from & separate it from the main domain:
One meaningless but neat little touch on the site is a hidden logo within the code itself, as spotted by @bamber123 on Twitter. In the scheme of things this isn’t massive, but it shows some attention to detail, and is the kind of thing that will get a few extra press mentions & some attention among tech-savvy people for very little additional effort:
As a few other tech notes: The site uses a mixture of technologies, sat on Microsoft IIS, with Varnish caching, Amazon server infrastructure, ‘Signal’ (formerly brighttag) for connecting data, both Google Analytics & Yahoo Analytics, and various other tech. Unlike the Obama campaigns, there are no big visible signs of A/B testing (though that doesn’t necessarily mean they’re not doing it), and unlike many campaigns today they don’t seem to be using an off-the-shelf campaign package like NationBuilder.
There are a few bits of advertising technology on the site, but not a massive amount for a campaign, and certainly nowhere near the scale a big publisher would use. In other words: All seems solid but not massively sophisticated. From the outside it doesn’t even feel as sophisticated as the Obama 2008 campaign from a tech point of view, though it’s early days & I could be severely misjudging it.
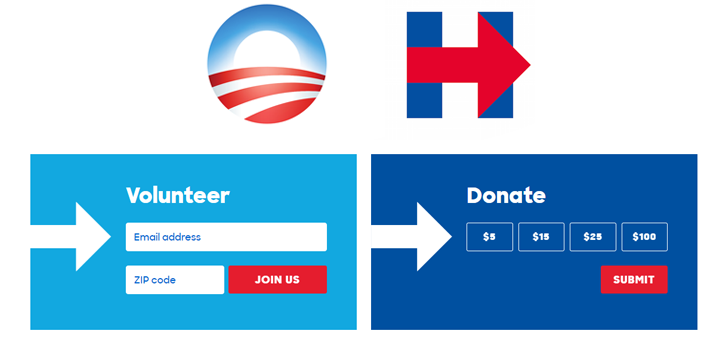
2. The Logo is useful as a UI element
There are lots of complaints about the logo on Twitter already – most along the lines of it being too simple, along with many noting its similarity to other logos. I actually don’t think ‘Simple’ is bad at all in this case. It has less depth than the famous Obama ‘Sun rising over a field made from an american flag in the shape of an O’ logo, but it’s very recognisable, the FedEx style arrow obviously indicates speed & forward movement, and – usefully – the arrow on its own works very well as a UI element alongside calls to action, and to draw your eye to important areas on the website:
Alongside the ‘arrow as nudge’ feature, it’s also worth noting they’re using various versions of the logo that work nicely on top of photographs, or in alternate colours. For example:
(As a tiny note on the above – if you look carefully at the logos second from the left & far right, you’ll notice the shade of red differs slightly. Meaningless to most of us, but not the attention to detail of an Obama campaign or an Apple launch certainly)
3. There were some some social miss-steps
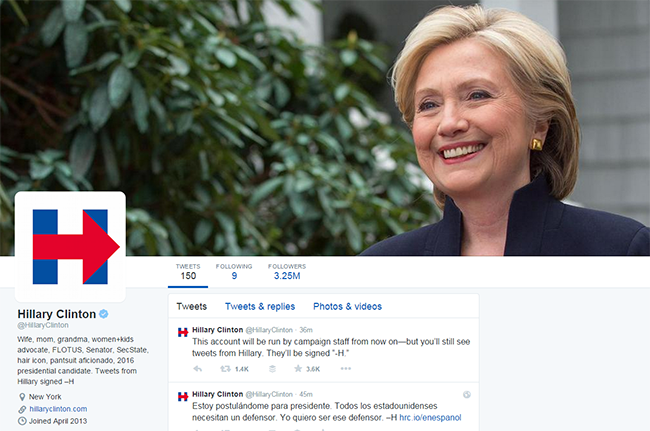
Within minutes of the announcement, Hillary’s Twitter & Facebook accounts had been updated to reflect she’s now officially running for president. The logo was updated, a tweet went out announcing her running, and the old ‘frowning in sunglasses on the phone’ header image was replaced by a smiling, screengrab-friendly shot of Hillary.
Within a couple of hours, Espanol content had been put out, and clarity had been added noting that the account will be run by campaign staff from now on with Tweets signed ‘- H’ attributable to Hillary herself:
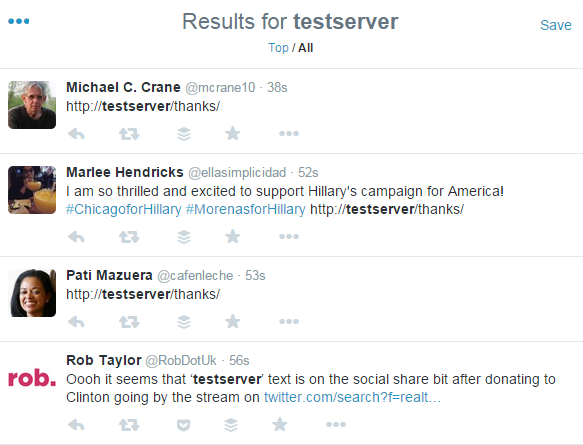
But… over on the HillaryClinton.com site, a few things hadn’t been updated. For example, one of the core social features of the site is to nudge users to share on Twitter/Facebook. As spotted by @RobDotUk on Twitter, when users share content it’s shared as “http://testserver/thanks” rather than “https://www.hillaryclinton.com/thanks”. That means firstly they miss out on any social traffic that may come from those tweets/shares, and that they look a little foolish in the eyes of some of their biggest supporters and make those supporters look a little foolish sharing broken links:
Not the end of the world, but still unfixed after a couple of hours, and after many hundreds of these erroneous shares.
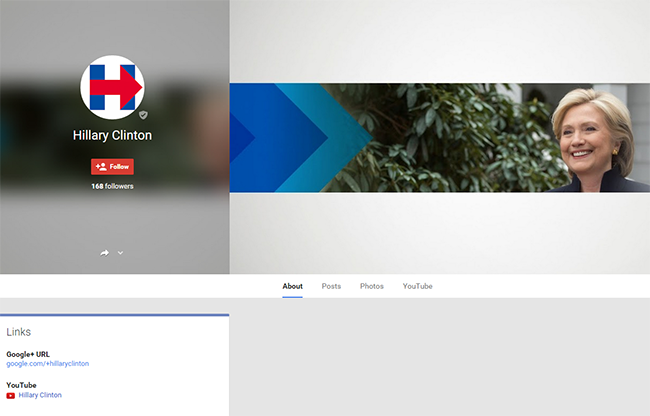
From a social point of view, the focus seems largely on Facebook & Twitter. Google+ is not visible among Hillary’s Google Graph profiles. She has launched a Google+ account (at plus.google.com/+hillaryclinton). That’s up from 0 to 168 followers in a few hours, but there are no posts:
I’d say that’s more a statement about the perceived importance of Google+ (very low) than about her digital campaign proficiency.
4. The Video
The early coverage of Hillary’s campaign launch focused on her campaign video:
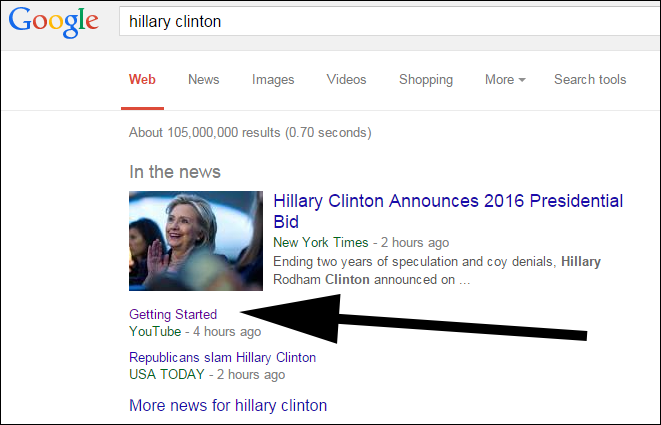
The video is very nicely put together from a production point of view, and a communications point of view, but there was an odd error. Here’s the link to the video within Google results:
As you can see, it simply says “Getting Started”. That’s what they’ve chosen as the title of the video within Youtube. That causes a few issues:
It doesn’t rank within youtube when searching for ‘Hillary Clinton 2016’ or any related terms (ironically, other networks have copied the video & given it a better title, meaning theirs do rank).
From a theoretical point of view it’s less likely to receive clicks from search results. “Getting Started” is far less clickworthy than something like “Getting Started – Official Hillary for America Campaign Launch” for example.
A niche, but interesting point: In March 2015, Youtube added an ‘autoplay’ feature, meaning once a video has finished, the viewer is automatically taken to another related video. In the case of Hillary’s video that means, at present, the video is auto-forwarding to some very odd videos including the below (note her video is called ‘Getting Started’, which is also in the title below):
Not a massive issue, and it will work itself out over time, but I’m sure her campaign team would prefer potential donors to see another Hillary video, rather than “Getting Started on Magic Online for $20”. In other words it indicates again a possible lack of attention to detail, or a gap in digital knowledge.
5. There were also some SEO miss-steps
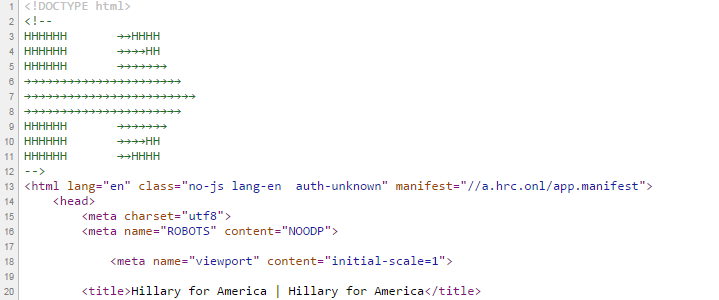
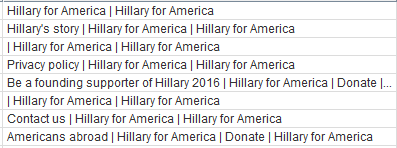
From an SEO point of view there were a few small miss-steps too. Some of these were fairly small, for example a quick look at the Title tags used on the site shows some messy, simple code errors (see ‘| Hillary for America | Hillary for America” duplication for example):
What won’t have much of a negative impact, but is surprising based on the amount of attention these types of things usually get.
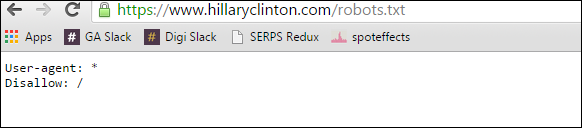
Slightly bigger than that is this:
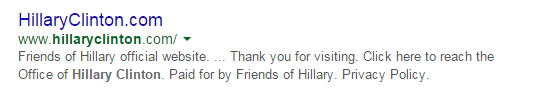
For those who don’t know what that means, the ‘robots.txt’ file tells bots & web crawlers what they are/are not allowed to view on a site. The line there that says “Disallow: /” tells Google and other search engines not to crawl any pages on the site. As a result, the site still looks like this in Google, rather than showing the new ‘Hillary for America’ branding:
Someone eventually noticed this, and it was fixed around 2.5 hours after the site launched, but this & the odd social blunders are quite surprising for a campaign that is likely to cost hundreds of millions of dollars (a ‘Ready for Hillary’ adviser suggested it could be well over a billion).
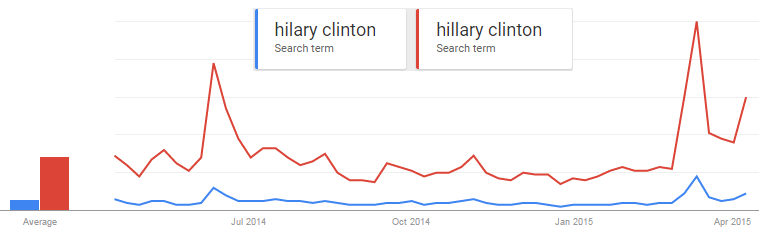
6. Hillary vs Hilary
Perhaps a pedantic point, but: Looking at Google Trends, it appears that roughly 15% of searchers do not know how to spell ‘Hillary’:
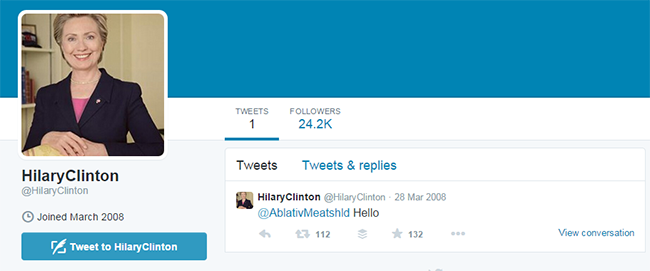
That’s not the end of the world – Google does its usual good job of showing results for the phrase ‘hillary clinton’ if mistyped, but anyone visiting www.hilaryclinton.com will find themselves at a dead end, and any of the 24,187 people who follow only the fake @hilaryclinton on Twitter will miss out on genuine updates.
As a side-note, there is of course the minor risk there that the account starts tweeting again & causes embarrassment.
Again, these are relatively minor issues, but it should not be a difficult job to buy the typo domain hilaryclinton.com from its current owner, and to claim the impersonating twitter account.
7. The site doesn’t appear to be finished
Alongside the oddities mentioned above, there are various parts of the site that simply aren’t finished. Naturally they’ll extend the site over time, but there are things that are actively broken at the moment.
For example, if you sign up for the email list, the ‘Thank you’ email finishes: “Stay tuned for more opportunities to get involved with the campaign. In the meantime, ask your friends and family to join us: HillaryClinton.com/Now-Ask-Your-Friends-to-Join-Us”. Sadly, clicking the link there takes you to a page that asks you to sign up again, and includes no possibility to share with friends:
This is easy to fix, but – for a site with only a dozen or so pages these are errors that should really have been picked up. Another example is the ‘jobs’ page. Hillary was a speaker at the last SalesForce summit. It now becomes clear why she did that: They’re using SalesForce as the relationship management solution for at least part of the campaign, and the ‘jobs’ element of the HillaryClinton.com site. Here’s how that looks:
Not the end of the world, but:
It doesn’t seem fully finished – there’s no lead-in text at all, and if you submit a half-finished application there are no error messages, or confirmation messages. (and the only field marked mandatory is ‘Last Name’).
If you look carefully, you can see the URL there is ‘hrc-demo.secure.force.com’. Hopefully they are correctly storing data submitted, but the inclusion of the word ‘demo’ there indicates that was not supposed to be the live version.
Aside from the 2 examples above there are various other elements that simply appear to be missing from the site, but I won’t labour the point.
Summary
Hillary Clinton’s 2016 campaign launch was nicely done from a digital point of view, with a smooth flipover of the social accounts & some very nice messaging from a communications point of view. There were however some very odd technical, social, and SEO misses.
With every site launch, and every campaign launch, some errors occur. In this case none are campaign-threatening in any way, but, they’re very surprising as some are so basic, the campaign is so massively high profile, the site itself is simple enough to make checking easy, and the team will be very aware – from the messy healthcare.gov launch in 2013 – of the reputational damage that can be caused by tech glitches.
Do leave a comment if you have anything to add, or think any of the above is unfair. And do share this post if you think others would find it useful.
Four of the UK’s largest broadcasters have announced plans for a series of leadership debates prior to the next general election. The BBC, ITV, Sky and Channel 4 plan to hold 3 debates:
One with the Conservative & Labour parties.
One with those parties plus the Liberal Democrats.
One with Conservative, Labour, Lib Dem, and UKIP.
Their belief appears to be that this is what the public wants. I was not sure whether that was the case, therefore I carried out a poll of just over 1,000 people to find out. I gave the options of the above, plus a fourth option “All parties with at least one MP”.
The Overall Results
Here is the result of a survey of 1,003 people within the UK, asking the following question:
“Which political parties should be invited to appear in televised leadership debates ahead of the 2015 General Election?”
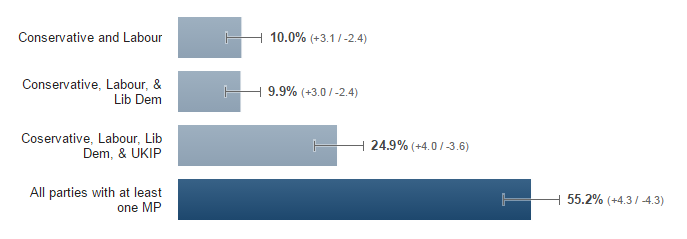
In summary, here is the breakdown, weighted to match the internet population of the UK:
As you can see, this is a significant result.
Just 10% opted for the 2 main parties alone.
Even less wished for the 2 main parties plus the Lib Dems.
The first 3 options combined make up the 3 debates planned by the BBC, ITV, Sky and Channel 4. Even when totaled up, these 3 options still form less than 50% of respondents’ preferred opion.
Well over half of respondents wish for all parties with at least one MP to be invited to the leadership debates.
Summary: Respondents to a poll of over 1,000 people in the UK want all parties with at least one MP to be invited to televised leadership debates.
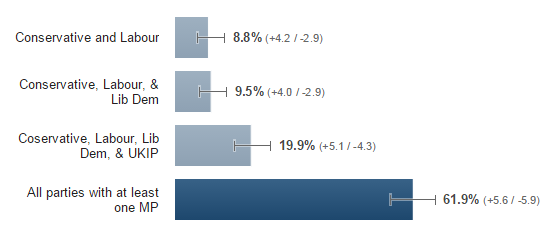
Split by gender, the result looked as follows:
Result from Women
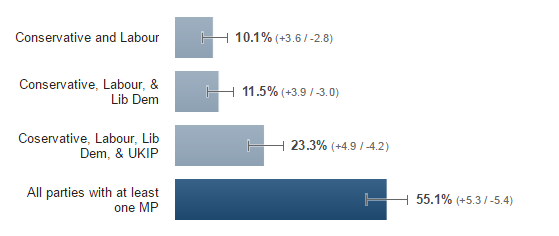
Result from Men
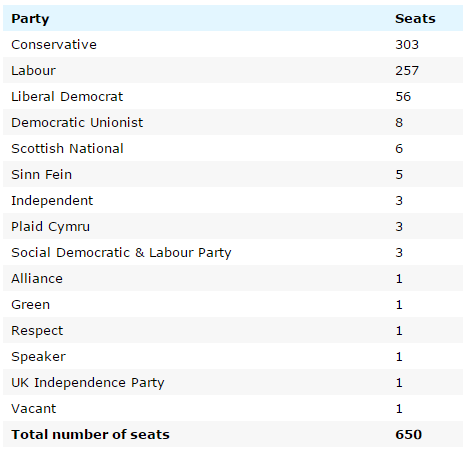
In summary: If we accept the poll as anywhere near representative of broader opinion, t is clear that the population of the UK would favour all parties with at least one MP be invited to appear in televised debates. At the time of writing those are as follows:
Appendix: Further Details
The survey was carried out between 14-16 October 2014. Users were surveyed while browsing websites. The breakdown of websites where users were asked the question was as follows:
News: 29.6%
Mobile: 18.9%
Arts & Entertainment: 17.1%
Other: 34.3%
Here is the makeup of the responding group, and their bias +/- the overall internet population of the UK:
If you’d like further details, drop a comment below or do get in touch. If you find this useful or interesting, please do share it with others.
The Scotland referendum question is worded like this:
“Should Scotland be an independent country?”
As a result, the “Independent Scotland” campaigners are called the “Yes” camp, and those who want the UK to stay together are the “No” camp.
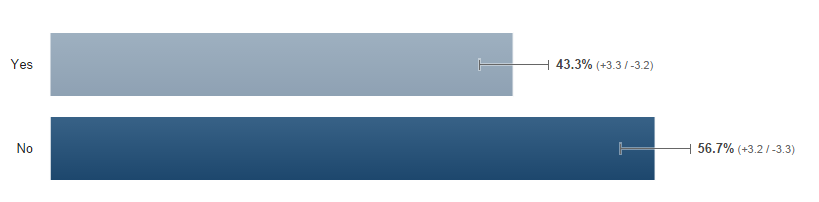
I’ve heard it suggested quite a few times that 犀利士 this puts the ‘unionists’ at a fundamental disadvantage: they’re trying to get people to vote for a negative result. I therefore thought it would be interesting to run a survey on the opposite question. Here’s the answer, when asked of 1,000 people within Scotland:
“Should Scotland be part of the United Kingdom?”
In other words: in a poll of 1,000 people in Scotland, when asked the reverse of the independence question, there was most definitely not a strong swing toward keeping the union.
You could ask further questions: “Has months of seeing ‘yes’ vs ‘no’ genuinely moved peoples’ opinions toward ‘yes’?”, would the ‘Yes’ campaign have been successful if they had been campaigning with ‘No’ banners for months, etc, but I think there’s enough here to satisfy the smaller question, and to say that the framing of the question does not appear to directly affect the likelihood of someone flipping their vote.
Appendix: Poll Details
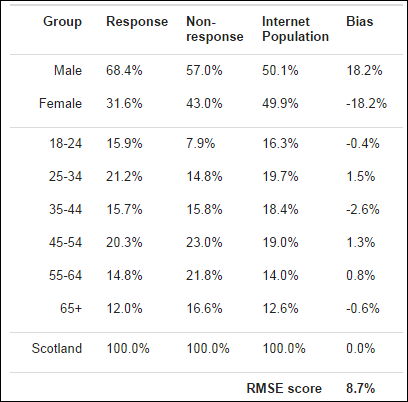
As per previous surveys I’ve carried out, this was carried out via the web. The results are weighted to match the ‘Internet Population’ of Scotland, which is generally thought to trend slightly younger & slightly more urban than the general population.
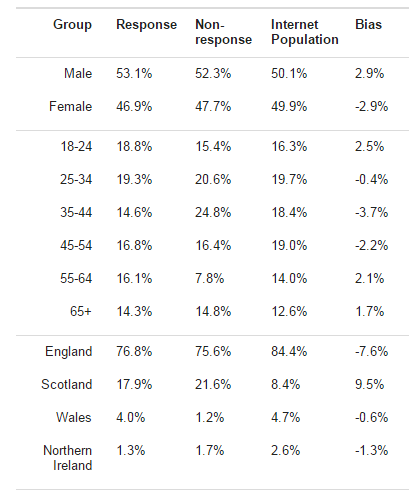
For full clarity, here’s the breakdown in the group of respondents:
I’ve carried out a series of these polls. You can see two more, with further caveats on the methodology here:
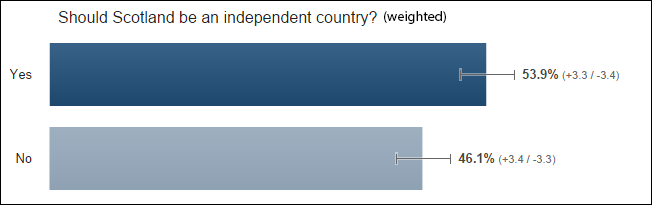
Here are the results of a poll run on a sample of Scottish web users between 7-9 September. The poll reported – when weighted to match the Scottish internet population’s general makeup – a 53.9% ‘Yes’ vote for the question “Should Scotland be an independent country?”
The poll results were from 1,000 people in Scotland (for context, the last YouGov poll was of 1084 poeple). The poll was displayed to web users as they browsed media, mobile, arts & entertainment websites. The question was displayed to 2,873 people, from which 1,000 responded. The “Yes” result was reported with 95% significance (meaning if the same poll were run 100 times, the answer would be “Yes” on at least 95 occasions).
Weighted Results: “Should Scotland be an independent country?
53.9% ‘Yes’
46.1% ‘No’
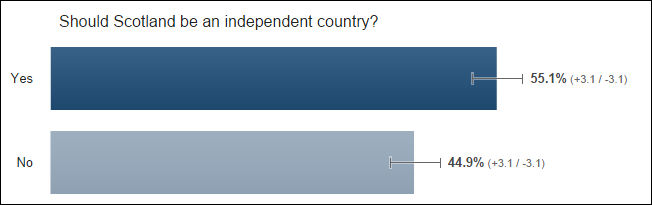
Unweighted Results: “Should Scotland be an independent country?”
The 1,000-person sample didn’t exactly match the makeup of the Scottish population (by age & gender), and therefore the above ‘weighted’ results have been altered to take that into account. For complete disclosure I’ve inc犀利士 luded the ‘unweighted’ results below, which actually lean further toward ‘Yes’. By unweighted results, I mean the results below are the ‘raw’ data, ignoring whether or not the age/gender of respondents matched the general internet users of Scotland.
55.1% ‘Yes’
44.9% ‘No’.
Do share this with others if you think they would find it interesting. Feel free to leave any/all comments below.
Appendix: Further Detail:
The poll ran & as displayed to a random sample of users within Scotland between 6:36pm on September 7th to 5:31pm on September 9th.
There was no “Don’t know” answer displayed.
The answers were displayed in the same order each time: ‘Yes’ first, ‘No’ second.
The question was worded as per the official question: “Should Scotland be an independent country?
There are lots of caveats with data such as this. It is a ‘snapshot’ rather than a ‘prediction’.
I have asked the specific ballot question, rather than framing it as “If you were to vote today, would you vote for Scotland to be an independent country?”.
I’ve left error bars on the results so that you can see the variability.
I included a series of caveats & additional notes on a previous similar poll I ran. You can read those in the ‘caveats’ section of this post.
For full clarity, here is the breakdown of respondents, and their bias vs the general ‘Internet Population’ of Scotland
Do share this with others if you think they would find it interesting. Feel free to leave any/all comments below.